 Apparatus
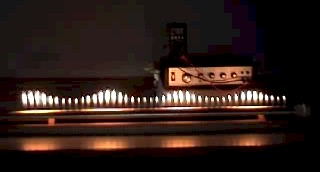
The photo at right of the apparatus taken at Hutt International Boys School (HIBS) near Wellington, New Zealand showing the flame tube and signal generator. Descriptions of multiple versions of the apparatus can be found on the internet.
This demonstration apparatus shows standing waves of sound in rather dramatic fashion. The tube is sealed at both ends. The left end of the tube in the photo above is connected to the gas supply while the right end is sealed with a speaker that is connected to the signal generator visible in the background. A standing wave will be set up in the tube when suitable frequencies are applied. Note that the closed ends of the tube are displacement nodes and therefore pressure antinodes. However, this experiment is complicated because the maximum height flames may be either pressure nodes or antinodes depending on the pressure, flow rate, and sound amplitude in the tube. Multiple papers have been published analysing this experiment, with a comprehensive analysis available in the American Journal of Physics: AJP 51(9), 848.
One can at least partially analyse the results in a very simple way. Whether the flame maximums correspond to pressure nodes or antinodes in a particular experiment, they will be half of a wavelength apart. Thus one can average the distance between successive flame maximums and double the result to obtain the wavelength. We have done this using VideoPoint, analysing images from several frames in the videos (links below), and have found that the wavelengths shown in the data table below.
The resonant frequencies can be determined to ± 3 Hz or so. The wavelength obtained from a VideoPoint analysis depends to some extent on which pair of flame maxima are used, particularly for the 768 Hz resonance. This difference provides some indication of the uncertainty. The movie can be scaled using the given length between the legs of the apparatus.
Data
The data below is taken from the videos:
| Resonant Frequency Observed | Wavelength | Calculated Wave Speed |
| 493 Hz, Not filmed | ||
| 768 ± 3 Hz | 63 ± 3 cm | 481 ± 25 ms-1 |
| 993 ± 3 Hz | 45.1 ± 0.6 cm | 448 ± 7 ms-1 |
| 1172 ± 3 Hz | 38.1 ± 0.5 cm | 447 ± 7 ms-1 |
| 1351 ± 3 Hz | 32.9 ± 0.2 cm | 445 ± 4 ms-1 |
Analysis
A rough estimate of the expected speed of sound in methane can be calculated from
![]()
in agreement with our measurements and other measurements. But note that any comparison between the measured and calculated speeds is of limited validity since the temperature and pressure in the tube are unknown and unlikely to be uniform, and both will change the expected speed. The point really is that a graph of frequency versus (1 / wavelength) produces a straight line verifying the form of the equation speed = frequency x wavelength.
This demonstration was conducted and filmed at Hutt International Boys School (HIBS) in collaboration with Mr. Gerald McIlhone.